The interactive dashboard below shows the 2022-23 greenhouse gas emissions baselines for Orkney, Shetland and the Outer Hebrides that were developed through the ICNZ project. The units are in kilotons of carbon dioxide equivalent[1]. The data can be filtered using the button panels on the right-hand side of the dashboard and more/less detail can be shown using the drill down/up options at the top right corner of the graph panel.
Interactive emissions baseline dashboard for each ICNZ island group
What are area-based greenhouse gas emissions?
The greenhouse gas emissions baselines for the Outer Hebrides, Orkney and Shetland that were developed for the ICNZ project are area-based. Essentially, this means they evaluate the emissions that occur within the geographic area of each island group (using the local authority boundaries) over the course of 2022-2023. While these baselines are broadly area-based, there are some exceptions to this:
- Emissions from grid electricity — emissions from electricity generation supplied to the grid are allocated based on where grid electricity is consumed (using a grid-average emissions conversion factor) rather than the location of electricity generation. This means that Orkney and the Outer Hebrides take a UK grid average emissions conversion factor. Shetland was not connected to the UK national grid for 2022-23, therefore it takes a Shetland-specific grid emissions factor (estimated as part of the ICNZ project).
- Emissions from waste — emissions from waste (that is not used for energy recovery) are allocated based on location of waste production, rather than location of waste treatment.
- Emissions induced by other activity within the geographic boundary — some emissions that occur outside the geographic boundary are also included in the baseline. For example, a proportion of emissions from aviation and maritime transport that cross the geographic boundary of each island group are included in the baselines.
The specific emissions that are considered in the baselines are aligned with the Global Protocol for Community-Scale Greenhouse Gas Inventories (GCP) which is an internationally recognised standard and guidance for area-based emissions developed by the Greenhouse Gas Protocol [1]. The emissions categories in the ICNZ baseline are aligned with the GCP, these are detailed in Table A.3 of the GCP [1, p.162].
How does the ICNZ baseline improve on other work?
Other organisations (including DESNZ [2] and SCIS [3]) have also developed area-based emissions baselines for the three island groups. The ICNZ baseline builds upon these existing resources, adding significant value in several areas:
- The ICNZ baseline follows the GCP standard more closely than any other emissions baseline for the three islands. This makes the ICNZ baseline easier to interpret that other work, as we have closely followed an established standard.
- The ICNZ baseline has a more comprehensive and island-specific emissions coverage than other baselines. This includes important sources of emissions such as ferries, aviation and fishing vessels, that are absent from other work. The ICNZ baseline therefore provides more complete information to assist decarbonisation decision making in the islands.
- The ICNZ baseline is supported by a set of detailed methodology documents and calculation tools, and a team of GHG emissions experts. This has built capacity within the wider ICNZ project to track emissions and make more informed decarbonisation decisions, rather than relying on analysis of third parties.
What are the important sources of emissions for the three island groups?
The sectors that contribute large amounts of greenhouse gas emissions are significantly different in the islands in comparison to Scotland or the UK as a whole. Additionally, on a per-capita basis the emissions of each island are much higher than national per-capita averages. The ICNZ baseline emissions are compared to UK and Scottish emissions data from the DA GHGI [4] on a per-capita basis below [2].
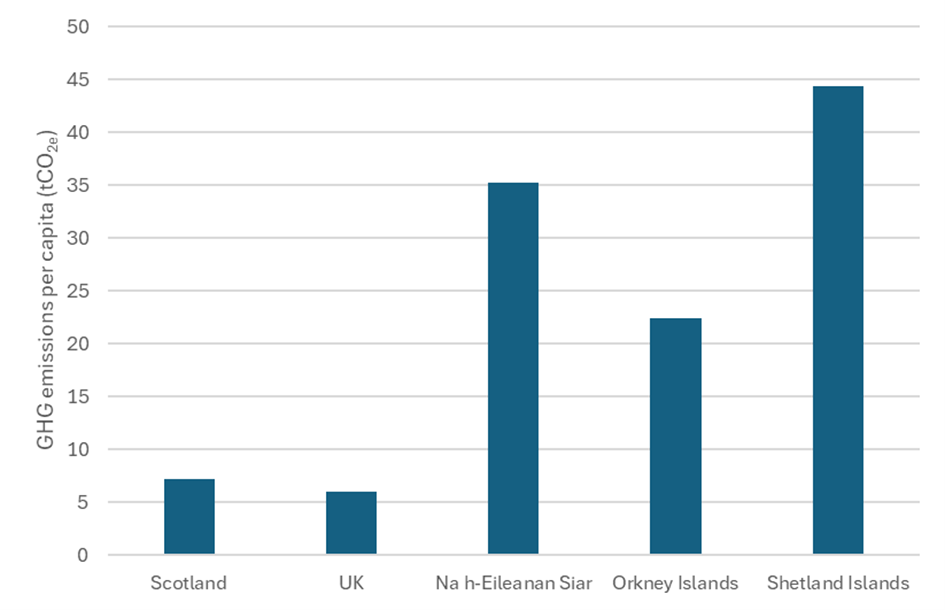
Figure 1 – These are the total per-capita GHG emissions for 2022-23 for each of the island groups compared to the UK and Scotland per-capita averages.
Some of the key sources of emissions for each island and commentary on how these differ to UK average per-capita emissions are highlighted below.
Common for all three island groups:
- There are significant emissions for each island associated with maritime transport and aviation, the majority of which are associated with journeys to the mainland UK. This makes per-capita domestic transport emissions around 2-3 times higher in the Islands than the UK average level.
- Land, specifically, land use for agriculture and peat land is a significant net source of emissions for each island. At a UK wide level, the sinks and sources of emissions from land are largely balanced.
Outer Hebrides:
- The largest source of emissions in the Outer Hebrides is the category Agriculture, Forestry and Land Use (AFOLU). These AFOLU emissions are dominated by Net emissions from degraded peat land contributing over 90% of these emissions.
Orkney Islands:
- The AFOLU category are the Orkney Islands’ largest source of emissions, closely followed by Stationary Energy.
- Within the AFOLU category, livestock is the largest source of greenhouse gas emissions, making up over 60% the AFOLU category total.
- Within the Stationary Energy category, the largest individual source of greenhouse gas emissions are Oil and Gas refineries (the Flotta Terminal), making up almost half of Orkney’s Stationary Energy emissions. Energy use (petroleum, electricity etc.) in agriculture and fishing activities are also significant in Orkney, making up around 25% of stationary energy greenhouse gas emissions.
Shetland:
- The Stationary Energy category is the Shetland Islands’ largest source of emissions, closely followed by AFOLU.
- Within the Stationary Energy category, the largest individual source of greenhouse gas emissions are Oil and Gas refineries (Sullom Voe and Shetland Gas Plant), making up almost 65% of Shetland’s Stationary Energy emissions. Additionally, emissions from electricity consumption in Shetland are around 3 times higher than in the other islands, as Shetland was not connected to the national grid in 2022-23, and derived much of its local grid electricity from fossil fuels.
- Within the AFOLU category, emissions are dominated by Net emissions from degraded peat land contributing over 80% of these emissions.
Looking forwards
Over the coming years ICNZ will be active in exploring ways to reduce carbon emissions across our Islands. The information gathered above will be key to knowing where to focus our efforts to make maximum impact.
A Household Carbon Calculator will be published later this summer which will enable households to easily calculate their carbon footprint and give ideas and inspiration about how to reduce carbon emissions.
As well as the Household Calculator, a Business Carbon Audit Service will also be launched, this will be a personalised service to help businesses accurately calculate their carbon footprint and explore practical opportunities for reduction of carbon emissions.
We will be updating the Regional Baseline in future years to track our progress on our journey to Net Zero.
Important note: We have used islands specific data where possible (e.g. for waterborne navigation, aviation and energy industries statistics), however some of the other figures are based on national averages from the Department for Energy Security & Net Zero. Because islands-based information for the other sectors is not currently available, ICNZ is developing the household carbon calculator and organisation carbon audit service mentioned above to enable us to build a complete picture over time. We aim to continue to improve the accuracy of this data set to help us, and other related projects across the islands, target the areas of highest emissions.
References
[1] Greenhouse Gas Protocol, “Global Protocol for Community-Scale Greenhouse Gas Inventories,” Washington, D.C, 2021.
[2] Department for Energy Security and Net Zero, “UK local authority and regional greenhouse gas emissions statistics, 2005 to 2022 https://www.gov.uk/government/statistics/uk-local-authority-and-regional-greenhouse-gas-emissions-statistics-2005-to-2022
[3] Improvement Service, “SCIS.” Accessed: Apr. 24, 2025 https://www.climateintelligenceservice.scot/
[4] National Atmospheric Emissions Inventory, “Devolved Administration Greenhouse Gas Emissions | National Atmospheric Emissions Inventory.” Accessed: Oct. 03, 2024 https://naei.energysecurity.gov.uk/greenhouse-gases/devolved-administration-greenhouse-gas-emissions
[1] different greenhouse gasses have different warming potentials, these have been converted into common units of carbon dioxide equivalent.
[2] Note that the aviation radiative forcing emissions have been removed from the ICNZ baseline figures for this, and international aviation and shipping has been removed from the Scotland and UK DA GHGI totals to allow for a comparison on the same basis.